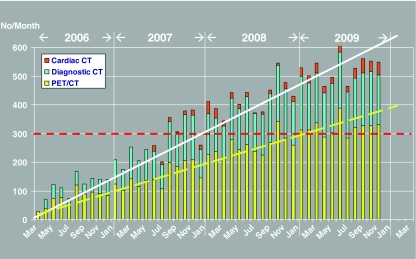
Fig. 2.
The monthly development in PET/CT at Odense University Hospital. The y-axis displays the number of examinations. The dotted horizontal red line indicates the maximum practical capacity with three PET/CT systems according to the Danish National Board of Health [26]

