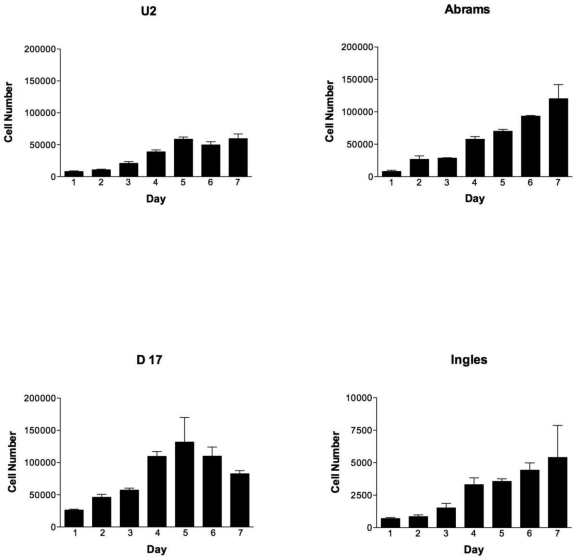
Figure 1.
OSA cell lines proliferate differently over time, with the Abrams cell line outperforming U2. Cell numbers per cell line (U2, Abrams, D17 and Ingles represented) over the 7 day experimental period. Please note that the cell numbers (on the Y axis) spans 0-200,000 cells for all cell lines except the Ingles which proliferated so slowly that the Y-axis spans 0-1,000 in order to visualize the data for this cell line. Error bars represent standard deviation.

