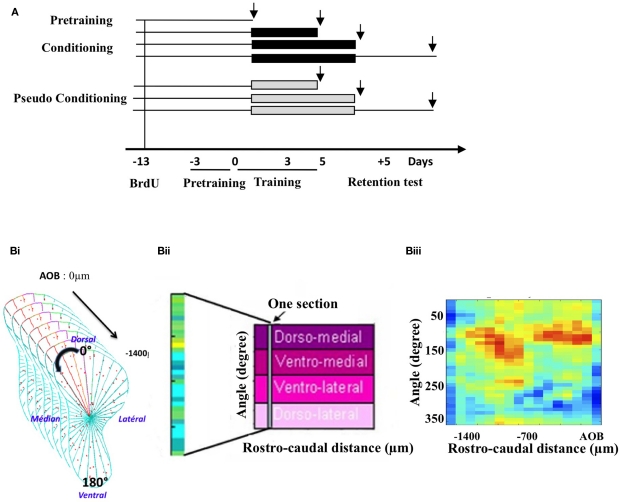
Figure 1.
Experimental design and cell mapping procedure. (A) Groups and timing of the experiment. Following a 3-day pre-training period, animals were submitted to an olfactory conditioning or pseudo-conditioning. They were sacrificed either before conditioning (pre-training) during (on day 3 and on day 5 of conditioning) or 5 days post conditioning, after a retention test. Black arrows indicate times of sacrifice, intervening 1 h after the last behavioral trial. To assess neurogenesis at these different time points, BrdU was administered 13 days before conditioning. (B) Principle of the labeled cell mapping method. Serial coronal sections of the OB were processed for BrdU or activated-caspase3 immunohistochemistry and every labeled cell was then counted on each section. The GCL was divided into 36 sectors of 10° and a density of labeled profiles was calculated for each sector (Bi). The value of cell density obtained was then reported into a matrix in which one column represented all the sectors of one section. Sections were aligned along the rostro-caudal axis (Bii). Finally, pseudo-color representation of the matrix was generated, giving a 2-dimension image of the density of labeled cells in the GCL. An example of such representation is given (Biii).

