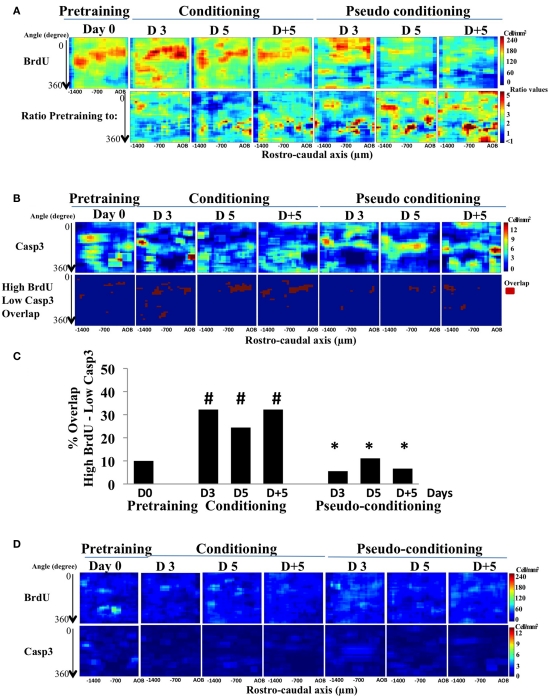
Figure 4.
BrdU- and activated-caspase3-positive cell mapping in the GCL. (A) Pseudo-color maps of Brdu-positive cells (BrdU; upper panel) and of the ratio BrdU-positive cell-density map of pre-training to all other groups (lower panel). (B) Activated-caspase3-positive (casp3) cell-density maps and maps of the overlap between high BrdU and low caspase3 cell densities. (C) Quantification of the overlap between high BrdU and low casp3. #p < 0.05 for difference from pre-training; *p < 0.05 for difference from corresponding time points in conditioned groups. (D) Maps of standard deviation (SD maps) associated with each bin of the BrdU- and activated-caspase3-postiive cell maps shown in (A).

