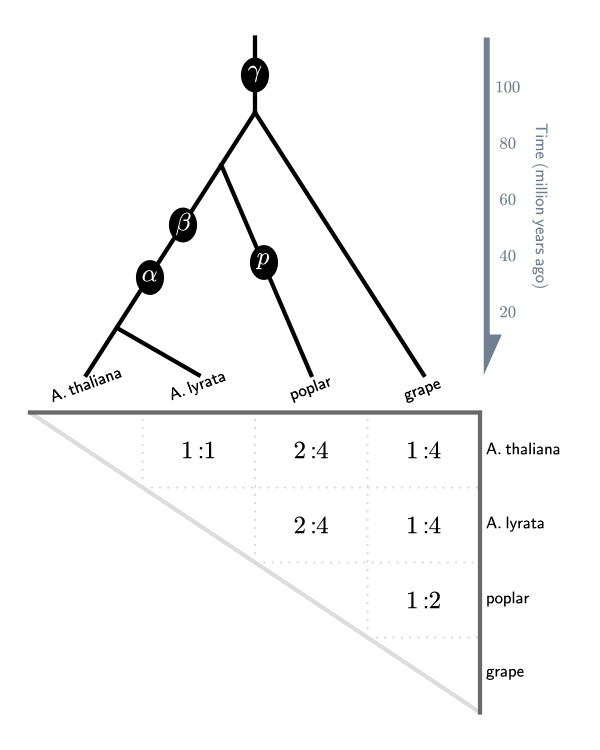
Figure 2.
Phylogeny for the rosid genomes used as test cases in this study, with known ancient WGDs marked on the branches. Phylogeny of rosid genomes with circles denoting polyploidy events. α, β and ρ: tetraploidies; γ: hexaploidy. The quota displayed in the table are in the form of QX:QY, where QX is the expected multiplication level for the genome on the top of the table, and QY is the expected multiplication level for the genome on the right.

