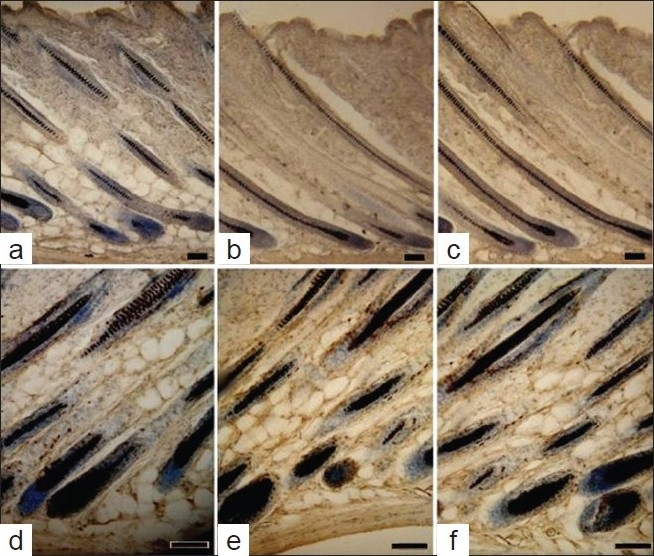
Figure 6.

IHC results shown for groups A, B and C. (a) is control group, it has light brown coloration in dermis; (b and c) are CPE and minoxidil treatment groups; they have deeper color than control. Lesser labeled cells are found in water topical treatment group; (d) and the CPE treatment group; (e) has more labeled cells than water application group, (f), minoxidil topical treatment group had more brown cells than other two groups. Scale bar = 50 µm
