
Figure 1.
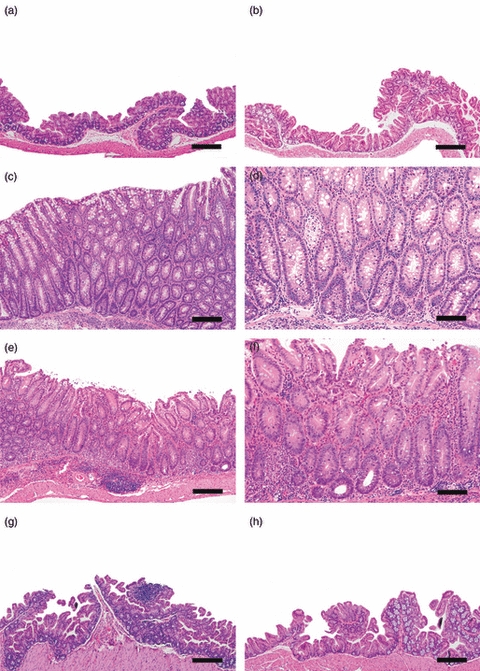
Germ-free B6.129P2-IL-10tm1Cgn (IL-10−/−) mice were colonized at 6–8 weeks of age with Lactobacillus reuteri, Helicobacter hepaticus or L. reuteri followed in 1 week by H. hepaticus and killed and examined post-mortem at 8–11 or 20 weeks post-infection (p.i.). (a) Caecal–colonic junction from helicobacter-free specific-pathogen-free (SPF) IL-10−/− mouse at 28 weeks of age that lacked gross or histological lesions at necropsy. (b) Caecal–colonic junction from IL-10−/− mouse mono-associated with L. reuteri for 20 weeks. Note absence of lymphoid development. (c, d) Representative low and high magnification images of the caecal–colonic junction from a positive control, 19-week-old SPF IL-10−/− mouse infected with H. hepaticus for 11 weeks characterized by mucosal and submucosal mononuclear inflammation, submucosal oedema, mild epithelial defects (glandular epithelial necrosis and luminal cell debris), hyperplasia and mild dysplasia characterized by architectural distortion involving glandular elongation, gland splitting, loss of columnar orientation and mild cytological atypia. (e, f) Representative low and high magnification images of the caecal–colonic junction of a gnotobiotic IL-10−/− mouse co-infected with L. reuteri and H. hepaticus for 20 weeks. Note mixed population of inflammatory cells in the lamina propria and distinct lymphoid aggregate in submucosa with associated mild oedema, epithelial defects (surface epithelial tethering, decrease in goblet cells, focal crypt necrosis and abcessation), mild hyperplasia and minimal to mild dysplasia (occasional loss of glandular columnar orientation and mild cytological atypia). (g) The H. hepaticus mono-association for 20 weeks did not result in significant inflammation and only mild lymphoid development in the caecal–colonic junction. (h) Caecal–colonic junction from germ-free IL-10−/− mouse at the 20 weeks p.i. time-point. Note lack of lymphoid development or histological lesions. Bars: a, b, c, e, g, h = 100 μm, d and f = 50 μm.