
Figure 6.
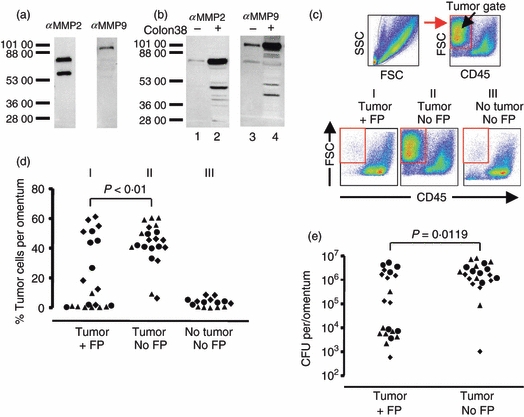
Fusion protein treatment reduces Colon 38 tumour growth in vivo. (a) In vitro expression of matrix metalloproteinase 2 (MMP2) and MMP9 using the Colon 38 tumour cell line. Immunoblot analyses of in vitro grown Colon 38 supernatants using the indicated antibodies. (b) In vivo expression of MMP2 and MMP9 from omental lysates with and without Colon 38 tumour present. Lanes 1 and 2 were probed with the anti-MMP2 antibody. Lane 1 contains omental lysate from an untreated mouse with no tumour. Lane 2 contains lysate from an omentum that had Colon 38 grown in vivo. Lanes 3 and 4 are replicates of lanes 1 and 2 except they were probed with an anti-MMP9 antibody. Dashes and numbers indicate apparent molecular weights. Note lower molecular weight bands probably represent cleavage products. (c) Gating scheme and representative flow analyses used to identify tumour cells (high forward scatter, CD45 negative) growing in vivo on the omentum. Reconstitution experiments in which tumour cells were added to omental cells were used to establish the tumour gate, which is indicated by the box. Bottom panels are examples of flow analyses of omenta from mice which received tumour and MMP fusion protein treatment (panel I: tumour +FP), mice which had received tumour but no treatment with MMP fusion protein (panel II: tumour No FP), or mice which received neither tumour nor fusion protein (panel III: no tumour, No FP). (d) Compiled analyses of tumour cells detected on the omentum by flow cytometry. Each symbol represents an individual mouse. Different symbols indicate mice from three experiments. The P-value between the indicated groups was calculated using the Kruskal–Wallis test. (e) Viable tumour cells were determined by colony-forming assay. Symbols indicate individual mice. P-value was calculated using the Mann–Whitney U-test.