Figure 1.

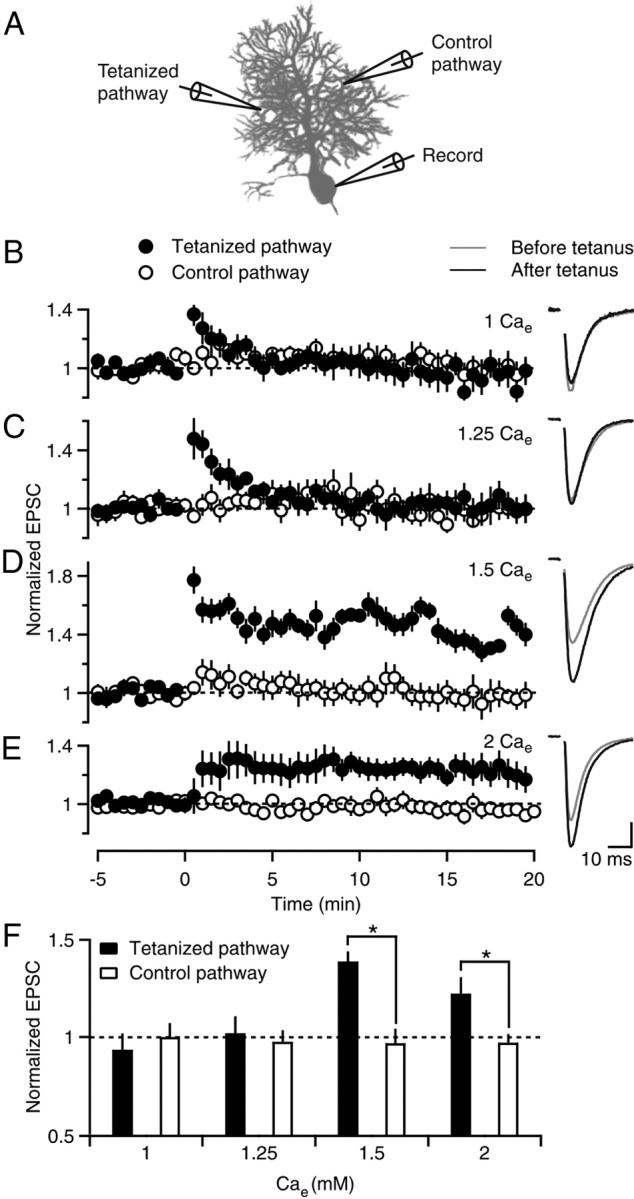
Sensitivity of PF-LTP to external calcium concentration. A, A schematic of the recording configuration shows two extracellular electrodes that were used to stimulate independent PF pathways (0.1 Hz) and a third electrode that was used to measure the amplitude of EPSCs from a PC soma. After a baseline response was determined, a tetanus (8 Hz, 15 s, t = 0) was delivered to one pathway, and the other pathway served as a control for recording stability. B–E, Left, Experiments were performed in the indicated external calcium concentration (Cae), and EPSCs were normalized to the amplitude before tetanic stimulation. Six to 10 experiments were averaged for each experimental condition. Filled and open circles indicate tetanized and control pathways, respectively. B–E, Right, EPSCs before (−5–0 min, gray line) and after (15–20 min, black line) tetanic stimulation are shown for representative experiments in the indicated Cae. Vertical scale bar (in pA): B, 38; C, 56; D, 71; E, 172. F, Experiments in B–E are summarized, where normalized EPSC amplitudes are plotted for the tetanized pathway (filled bars) and control pathway (open bars). *p < 0.05 (tetanized pathway vs control, one-way ANOVA).
