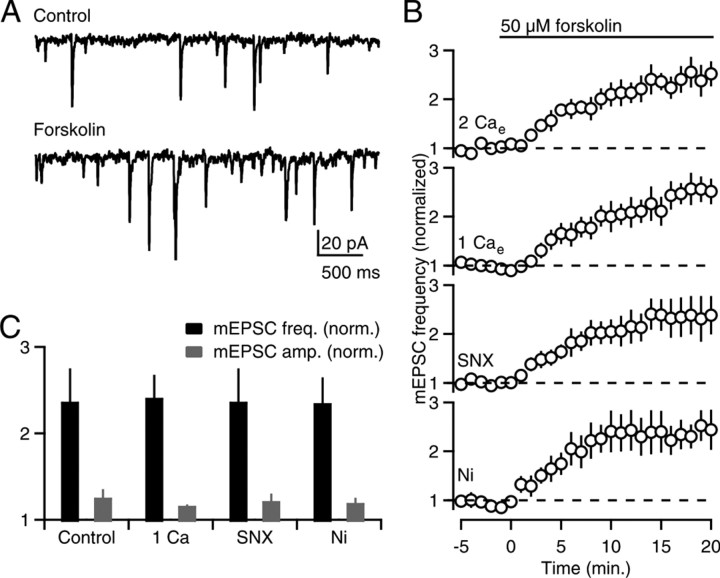
Figure 3.
Calcium-sensitivity of cAMP-stimulated mEPSCs. A, Example traces of mEPSCs recorded from a PC in control conditions (top) and after application of forskolin (bottom). B, Time courses of normalized mEPSC frequency in (from top to bottom) 2 mm Cae, 1 mm Cae, and in 2 mm Cae with either 500 nm SNX-482 or 100 μm NiCl2. C, Experiments in B are summarized. mEPSC frequency (black bars) and amplitude (gray bars) 15–20 min after forskolin application were normalized to control conditions (−5 to 0 min).

