Figure 7.

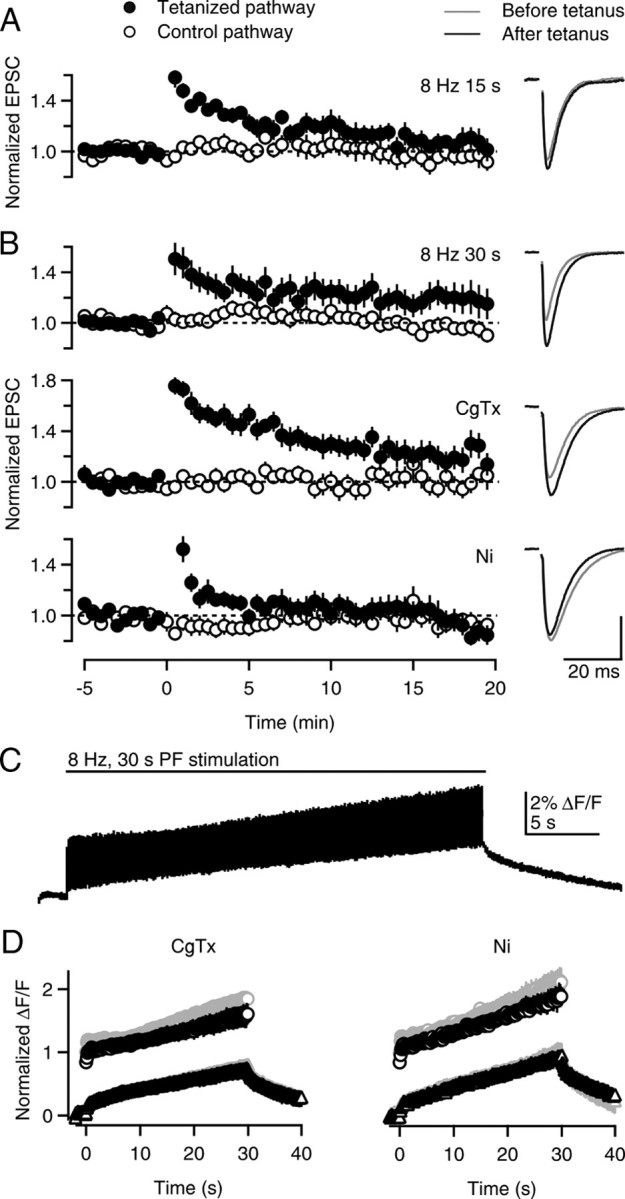
PF-LTP and presynaptic calcium signals at near-physiological temperatures. A, B, Time courses of normalized EPSCs (left) and example EPSC traces (right) are shown for LTP experiments conducted at 34 ± 1°C. A, LTP was induced with an 8 Hz, 15 s tetanus at t = 0. B, LTP was induced with an 8 Hz, 30 s tetanus at t = 0 in control conditions (top), in the presence of 500 nm ω-conotoxin GVIA (middle), or 100 μm NiCl2 (bottom). Vertical scale bar: A, 95 pA; B (from top to bottom), 293, 186, and 176 pA. C, An example Caglobal transient during an 8 Hz, 30 s tetanus is shown. D, Quantification of Caglobal peaks during the train (circles) and buildup of plateau calcium during the train (triangles) before (gray symbols) and after (black symbols) application of 500 nm ω-conotoxin GVIA (left) or 100 μm NiCl2 (right).
