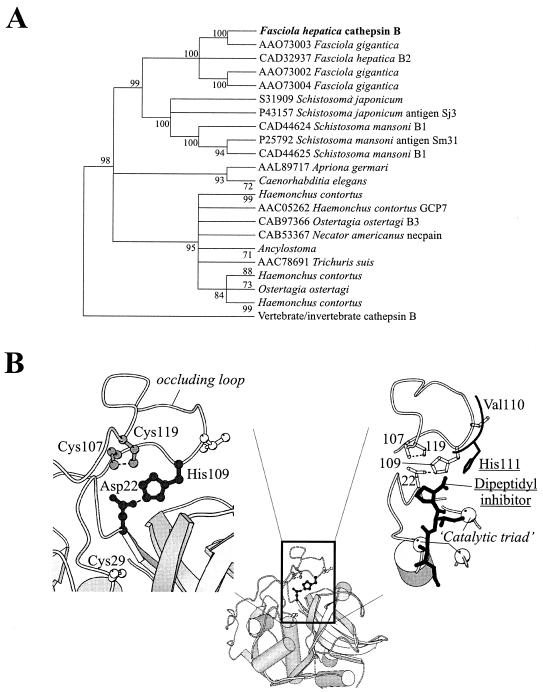
FIG. 2.
Evolutionary analysis and molecular modeling of FhCatB. (A) A bootstrap neighbor-joining tree (implemented by use of MEGA software [35]) is shown; the majority-rule bootstrap maximum parsimony tree was in agreement with it but was not as well resolved. Branches for which there was <80% support were collapsed. (B) A molecular model of F. hepatica cathepsin B, constructed as explained in the text, is presented, highlighting the constraints that are predicted to act within its occluding loop. (Left) The His109-Asp22 salt bridge (black ball-and-stick model) and the disulfide bond between Cys107 and Cys119 (gray ball-and-stick model) are shown; the active site Cys29 (white ball-and-stick model) also appears as a reference. (Right) For comparative purposes, the His111 residue of human cathepsin B (replaced by Val110 in the F. hepatica enzyme) and the dipeptidyl inhibitor with which it interacts are shown in black. In F. hepatica cathepsin B, the histidine-mediated stabilization of the substrate's carboxy terminus is predicted to be absent. Some elements of secondary structure have been stripped away and the positions of the catalytic residues are shown (white spheres). This figure was prepared with the use of MOLSCRIPT.

