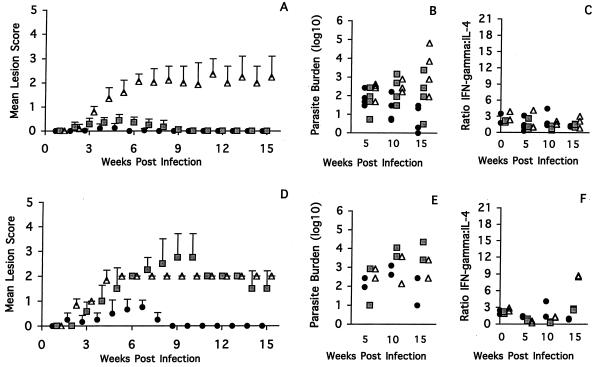
FIG. 2.
(A and D) Disease pattern in CBA/H (circles), DBA/2 (squares), and (C57BL/6J × BALB/c)F1 (triangles) mice infected intradermally in the ear (A) or tail (D) with 104 L. major Friedlin metacyclic promastigotes. The mean lesion scores and standard deviations are shown as a function of time. (B and E) Parasite burden at 5, 10, and 15 weeks after infection with 104 L. major Friedlin metacyclic promastigotes in the ear (B) or tail (E) are shown as in Fig. 1. (C and F) Ratio of IFN-γ to IL-4 at 0, 5, 10, and 15 weeks postinfection with 104 L. major Friedlin metacyclic promastigotes in the ear (C) or tail (F) is shown as in Fig. 1.

