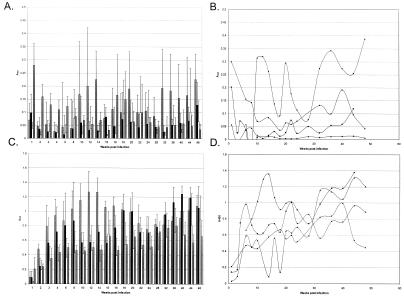
FIG. 3.
IgM (A and B) and IgG (C and D) antibody responses to Erp and OspC proteins mounted by mice infected with B. burgdorferi for 11 months. All examined mice yielded similar results. (A and C) Averaged responses for all mice. Bars (from left to right), ErpA, ErpL, ErpQ, and OspC, respectively. Error bars, 1 standard deviation of the means. (B and D) Analysis of a single, representative mouse (mean A405s obtained from triplicate wells). Diamonds, ErpA; squares, ErpL; triangles, ErpQ; circles, OspC.

