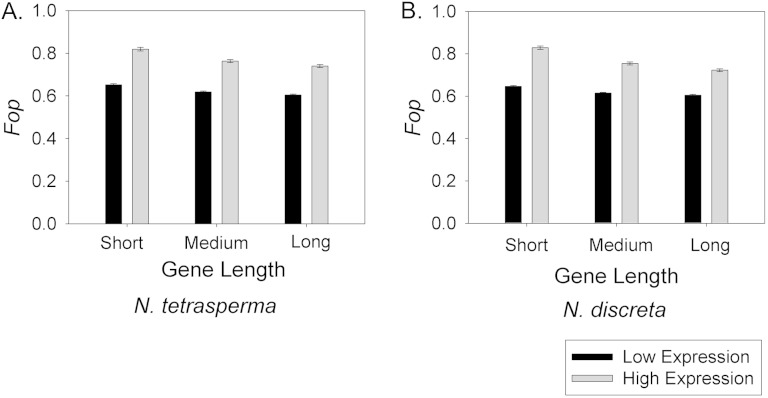
FIG. 2.—
The Fop value for genes from different GL categories and gene expression levels. (A) Neurospora tetrasperma and (B) N. discreta. All comparisons among GLs (per expression level) and among gene expression levels (per GL) within each figure are statistically significantly different (P < 0.05) after post hoc analysis of ANOVAs and correction for multiple tests. Error bars represent standard errors.

