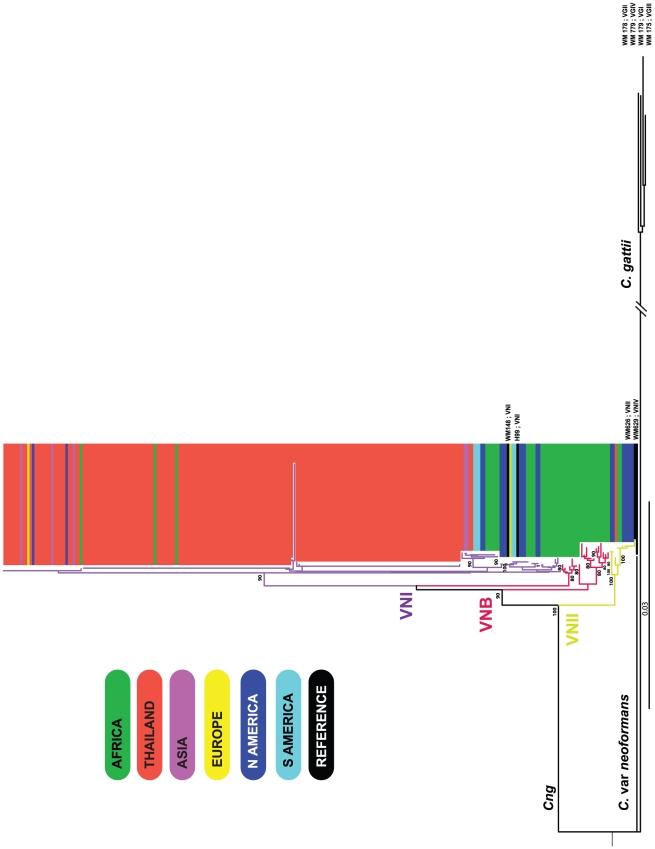
Figure 5. Neighbour-joining tree inferring the evolutionary relationships of the global Cng isolates included in this study (n = 261).
The geographical origins of the isolates are represented by coloured rectangles: green = Africa (n = 44), red = Thailand (isolates typed in this study; n = 186), purple = remaining Asian isolates (n = 5), dark blue = North America (n = 19), light blue = South America (n = 5) and yellow = Europe (n = 2). Black rectangles represent reference strains of known VN molecular types that are detailed on the figure for VNI (WM148, H99; n = 232), VNII (WM626; n = 11) and VNB (n = 21). Reference strains of the C. gattii complex (molecular groups VGI – IV) are labelled and serve as an outgroup: WM179, WM178, WM175 and WM779. The percentage replicate trees in which the associated taxa clustered together in the bootstrap test (1000 replicates) are indicated if supported by significant bootstrap values (n≥80%). The evolutionary distances were computed using the Maximum Composite Likelihood method and are in the units of the number of base substitutions per site.

