Figure 1.
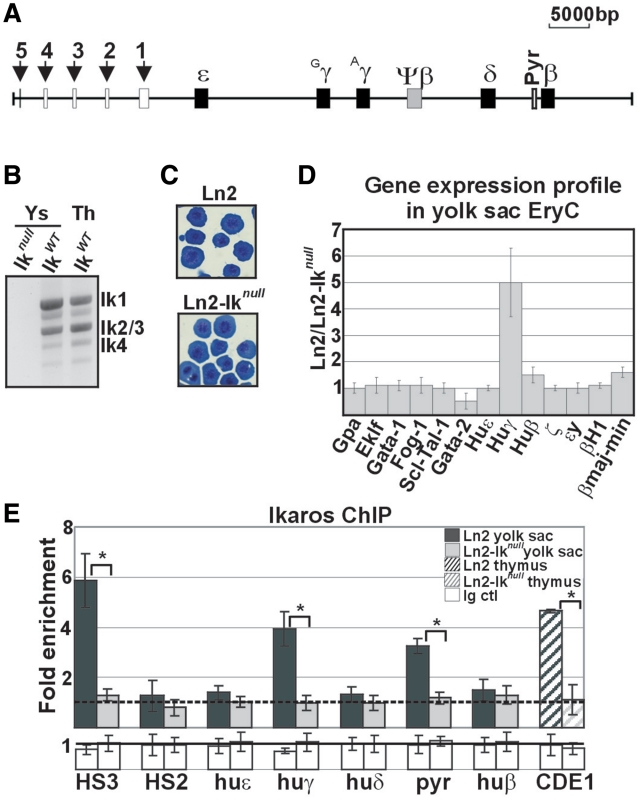
Morphological and molecular characterization of ln2 and ln2-Iknull yolk sac EryC. (A) Map of the human β-globin locus; black arrows indicate βLCR HSs; genes are indicated by black boxes; (B) RT–PCR performed on ln2-Iknull (Iknull), ln2 (IkWT) yolk sac EryC or ln2 (IkWT) thymus (Th) cells; (C) Wright-Giemsa staining of ln2 or ln2-Iknull yolk sac cells; (D) RT–qPCR of hematopoietic as well as globin gene transcripts performed on equal amounts of ln2 and ln2-Iknull yolk sac EryC; transcript quantification was calculated according to Pfaffl (73) using mouse Actin cDNA as internal control; ln2/ln2-Iknull ratios are plotted as the mean ± SD of the measurements; n ≥ 4; (E) ChIP on ln2 and ln2-Iknull yolk sac EryC or thymus cells carried out with Ikaros antibodies; immunoprecipitated and input chromatin samples were used as template in qPCR; quantification was carried out according to the 2−ΔΔCt method, using mouse kidney-specific Tamm-Horsfall protein (Thp) promoter as internal control; fold enrichments (y-axis) of globin regions relative to the control and the input samples are plotted as the mean ± SD of the measurements; a value of 1 (dashed line) indicates no enrichment; *P ≤ 0.05 by Student’s t-test; huε, huε-promoter; huγ, huγ-promoters; huδ, huδ-promoter; pyr, Pyr region; and huβ, huβ-promoter; dark gray bars: ln2 yolk sac EryC; light gray bars: ln2-Iknull yolk sac EryC; dark gray dashed bars: ln2 thymus cells; light gray dashed bars: ln2-Iknull thymus cells; white bars: isotype-matched Ig (Ig ctl).

