Figure 2.
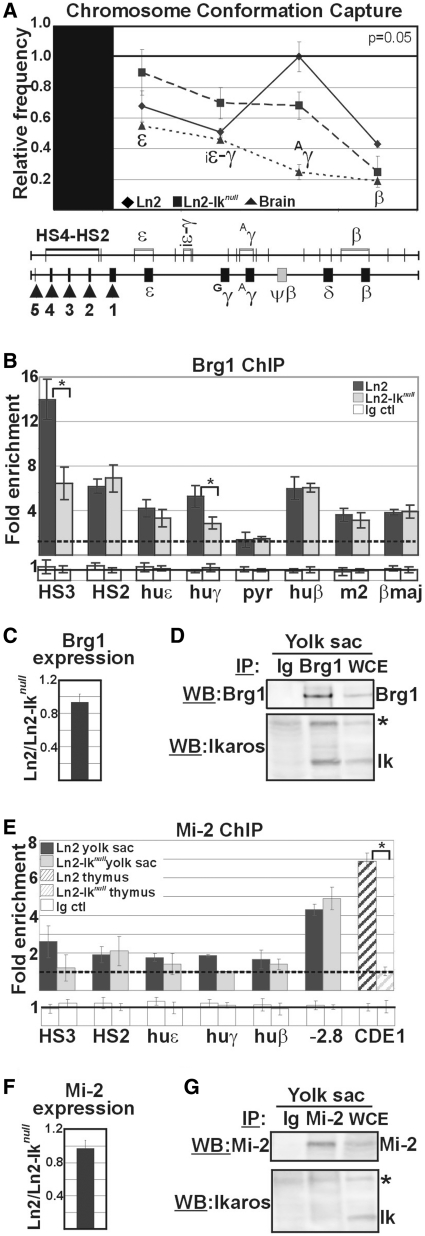
Brg1 and Mi-2 recruitment to the huβ-globin locus in ln2 and ln2-Iknull yolk sac EryC. (A) Ln2 and ln2-Iknull yolk sac EryC were subjected to 3C assay; nuclei were digested with EcoRI and genomic DNA was ligated and used as template for qPCR; βLCR HS4-HS2 EcoRI fragment was used as ‘fixed’ point and primer sets were designed in order to amplify the genomic regions corresponding to the ε, ε-gene; iε-γ, inter-ε-γ region; Aγ, Aγ-gene and β-gene region; relative crosslinking frequencies (y-axis) of the ‘fixed’ fragment with globin fragments were defined using naked DNA encompassing the whole huβ-globin as control and normalized to endogenous mouse Actin; a value of 1 was attributed to the highest crosslinking frequency; the data are plotted as the mean ± SD of the measurements of five independent experiments; x-axis: position across the locus; rhomboids: ln2 yolk sac EryC; squares: ln2-Iknull yolk sac EryC; triangles: brain cells; (B and E) ChIP on ln2 and ln2-Iknull yolk sac EryC or thymus cells carried out with Brg1 or Mi-2 antibodies; fold enrichments (y-axis) were calculated as described in Figure 1E and are plotted as the mean ± SD of the measurements; a value of 1 (dashed line) indicates no enrichment; *P ≤ 0.05 by Student’s t-test; huε, huε-promoter; huγ, huγ-promoters; pyr, Pyr region; huβ, huβ-promoter; m2, mouse HS2; βmaj, βmajor promoter; −2.8: −2.8 kb region upstream of the Gata-2 promoter and CD4E1: CD4 enhancer 1 region; dark gray bars: ln2 yolk sac EryC; light gray bars: ln2-Iknull yolk sac EryC; dark gray dashed bars: ln2 thymus cells; light gray dashed bars: ln2-Iknull thymus cells; white bars: isotype-matched Ig (Ig ctl); (C and F) RT–qPCR of Brg1 and Mi-2 gene transcripts performed on equal amounts of ln2 and ln2-Iknull yolk sac EryC; transcript quantification was calculated according to Pfaffl (73) using mouse Actin cDNA as internal control; ln2/ln2-Iknull ratios are plotted as the mean ± SD of the measurements; n = 6; (D and G) Protein co-IP of total cell lysates prepared from ln2 yolk sac EryC; cell lysates were immunoprecipitated with Mi-2 or Brg1 antibodies as well as isotype-matched Ig; samples were resolved on SDS–PAGE, immunoblotted and WB membranes were cut in half; the higher half was probed with either Mi-2 or Brg1 antibodies, whereas the lower half was probed with Ikaros antibodies; asterisks indicate non-specific bands; WCE: yolk sac EryC total cell lysate.

