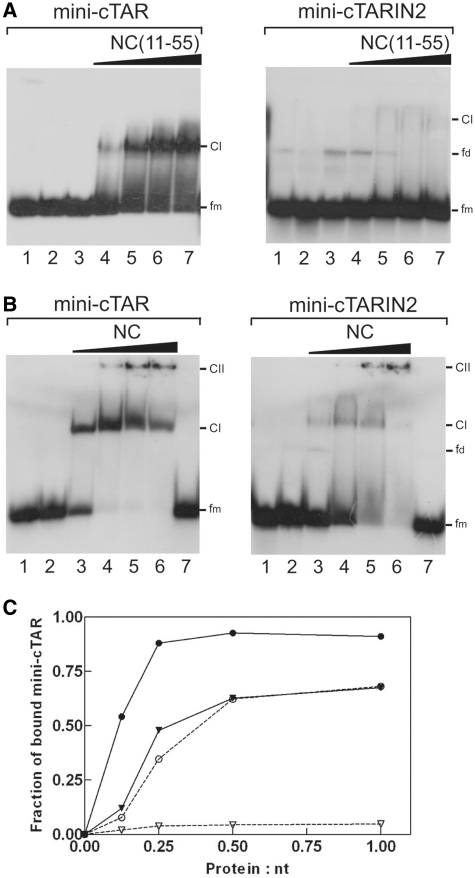
Figure 10.
Gel retardation assays of protein:mini-cTAR DNA complexes formed in vitro. Mini-cTAR 32P-DNAs were incubated in presence of NC(11-55) (A) or NC (B) and analyzed by electrophoresis on a 14 % polyacrylamide gel as described in ‘Materials and Methods’ section. (A) Lane 1, controls mini-cTAR dimerization induced by NC(11-55) at a protein to nucleotide molar ratio of 1:1 (NC(11-55) was removed by phenol/chloroform before gel electrophoresis); lane 2, heat-denatured mini-cTAR DNAs; lanes 3, controls without protein; lanes 4–7, protein to nucleotide molar ratios were 1:8, 1:4, 1:2 and 1:1. (B) Lane 1, heat-denatured mini-cTAR DNAs; lane 2, controls without protein; lanes 3–6, protein to nucleotide molar ratios were 1:8, 1:4, 1:2 and 1:1; lane 7, controls mini-cTAR dimerization induced by NC at a protein to nucleotide molar ratio of 1:1 (NC was removed by phenol/chloroform before gel electrophoresis). Monomeric and dimeric forms of free mini-cTAR DNAs are indicated by fm and fd, respectively. CI indicates the protein:mini-cTAR complexes. CII indicates the high-molecular-mass protein:mini-cTAR complexes (aggregates). (C) Fraction of bound mini-cTAR as a function of the protein/oligonucleotide (expressed in nt) ratio. The graph was derived from the experiments shown in (A) and (B). Continuous line, mini-cTAR; broken lines, mini-cTARIN2; triangles, NC(11-55); circles, NC.

