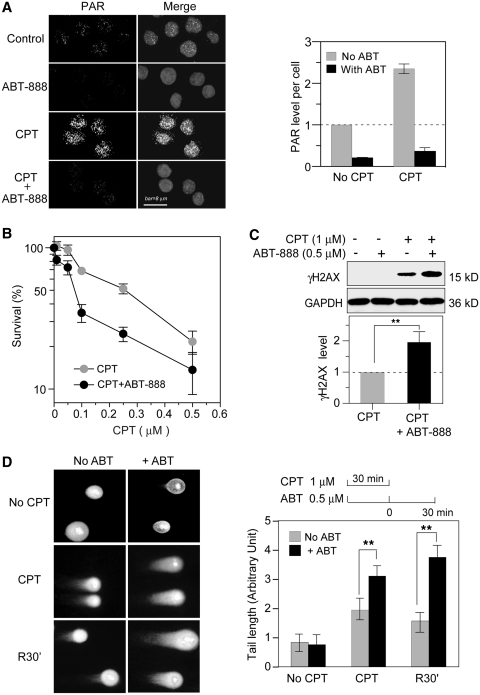
Figure 1.
Potentiation of CPT-induced DNA damage by the PARP inhibitor ABT-888 in human colon cancer HT-29 cells. (A) Fluorescence images of PAR. Cells were treated with 1 µM CPT for 30 min in the absence or presence of ABT-888 (0.5 µM). Nuclei were labeled with PI (gray signals in the Merge images) and PAR polymers are shown as white dots. Bar = 8 µm. Right, PAR quantitation (mean values ± SD) using untreated Control set as one. (B) Cytotoxicity assays. Cells were treated with CPT for 72 h in the absence or presence of ABT-888 (0.5 µM). The survival of untreated cells was defined as 100%. Data are shown as mean values ± SD (n = 3). (C) Enhancement of CPT-induced γH2AX by ABT-888. Cells were treated with CPT for 30 min in the presence or absence of ABT-888 (0.5 µM). γH2AX was determined by Western blotting: Top: representative experiment; Bottom: γH2AX levels were quantified from three independent experiments (mean values ± SD) using CPT-induced γH2AX levels set as one (**P < 0.01). (D) DSB measured by neutral COMET assays. Cells were co-treated with CPT and ABT-888 for 30 min; R30′: cells were examined 30 min after CPT removal in the absence or presence of ABT-888 (0.5 µM). Left, representative images; Right top: treatment schedule; Right bottom: quantitation of average tail lengths. At least 50 cells were quantified in each data set. Data are shown as mean values ± SD. Standard t-tests were used for statistical analyses; **P < 0.01.

