Figure 3.
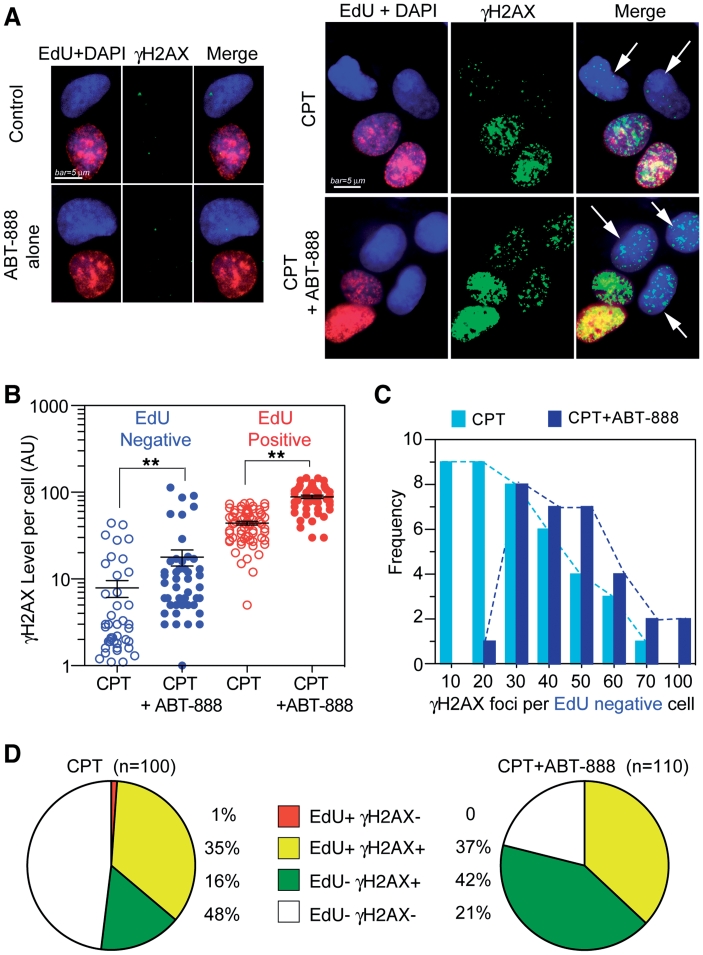
ABT-888 enhances both replication-dependent and independent γH2AX induced by CPT. Human osteosarcoma U2OS cells were treated with CPT (1 µM) for 30 min in the presence or absence of ABT-888 (0.5 µM). (A) The fluorescent thymidine analog EdU was used to identify S-phase cells by labeling their DNA (red signal). γH2AX is shown in green signal and nuclei labeled with DAPI are in blue. Representative immunofluorescence images (bar = 5 µm). White arrows indicate EdU negative but γH2AX positive cells. (B) Scattered-dot plot derived from the analyses of γH2AX level in individual cells in one representative experiment (see Supplementary Figure S4 for an independent experiment). Mean values ± SEM are shown as black bars. Number of cells analyzed: EdU-/CPT: n = 67; EdU + /CPT: n = 42; CPT + ABT: n = 46 (EdU+), n = 60 (EdU-). Standard t-tests were used for statistical analyses of the data from the representative experiment, **P < 0.01; (C) Distribution of γH2AX foci numbers per EdU negative cells in the presence and absence of ABT-888. Dotted curves link the edges of columns (Light blue, CPT alone; Dark blue, CPT + ABT-888). (D) Percentage distribution based on EdU and γH2AX showing γH2AX enhancement in EdU negative cells.

