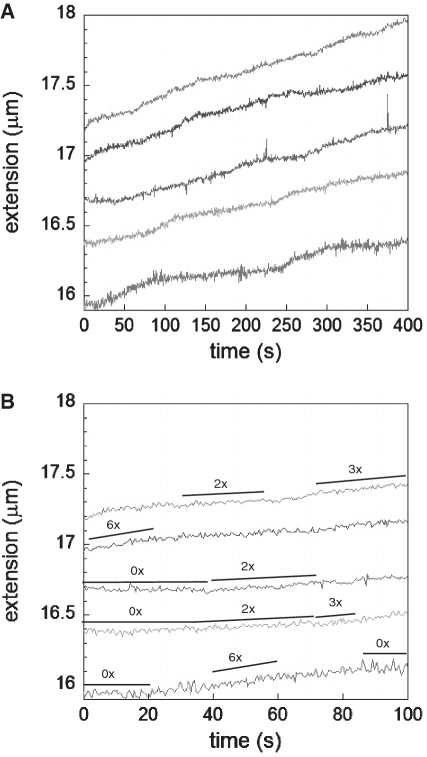
Figure 3.
Extension versus time for RecA growth on dsDNA at pH 7.6, 10 mM MgCl2 and 1 mM ATPgS at 10 pN, 20 pN, 30 pN, 40 pN and 50 pN (bottom curve to top curve, respectively). (A) Full-time range. (B) Replotting the first 100 s where a few growth rates that are twice, three and six times the average rate, are indicated with the black lines next to each curve. In addition, periods where no growth is observed are indicated as 0×.

