Figure 5.
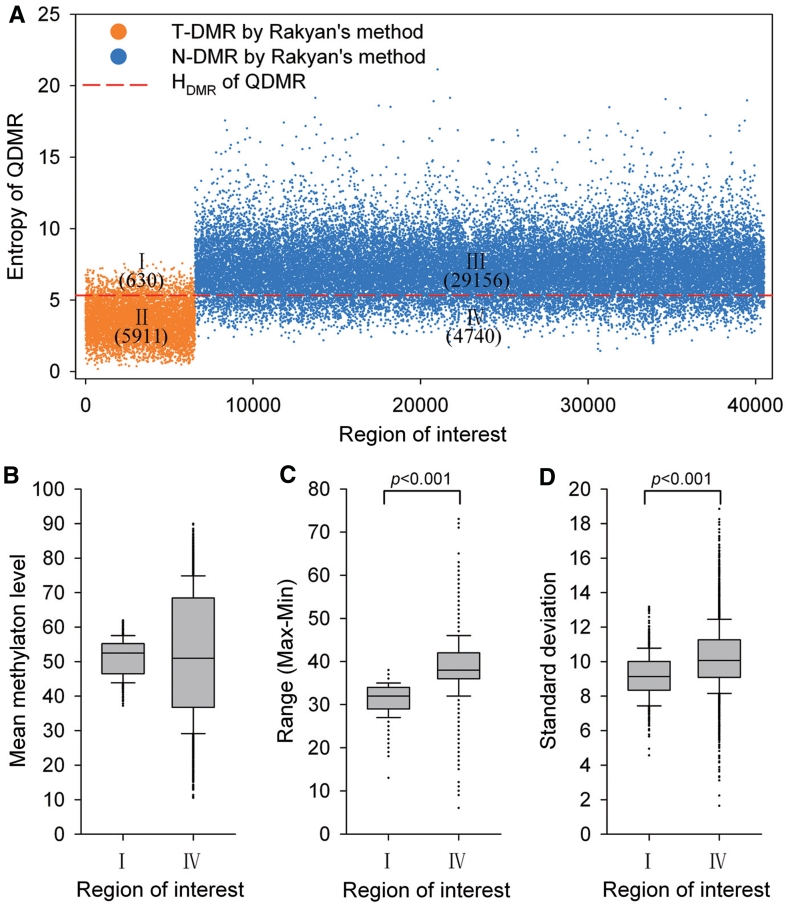
Performance of QDMR in identification of T-DMRs and N-DMRs. (A) Different categories of regions by Rakyan’s method and QDMR. X-axis are the ROIs which are divided into two groups according Rakyan’s method, T-DMRs represented by orange dots (I and II), and N-DMRs represented by blue dots (III and IV). Y-axis is the entropy for each ROI derived from QDMR. All 40 437 regions are classified as N-DMRs (I and III) and T-DMRs (II and IV) by DMR threshold represented by the red line. The number indicates the amount of regions in the corresponding category. (B) The mean methylation levels across 16 tissues of the regions in I and IV. (C) The range of methylation levels in 16 tissues of the regions in I and IV. (D) The standard deviation of methylation levels in 16 tissues of the regions in I and IV.

