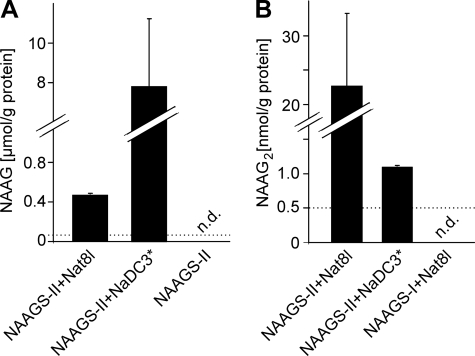
FIGURE 5.
Quantification of NAAG and NAAG2 synthesis in HEK-293T cells. HEK-293 cells were transfected with plasmids encoding NAAGS-II and Nat8l or NaDC3 (in NaDC3 expressing cells, 10 mm NAA was added to the culture medium). Methanol extracts were prepared and subjected to HPLC/ESI-MS analysis. A, NAAG was quantified by HPLC (detection at 214 nm). The detection limit for NAAG was 0.006 μmol/g of protein. B, NAAG2 was quantified by ESI-MS (mass peak of m/z = 432.1; see Fig. 4) using synthetic NAAG2 as external standard. The detection limit for NAAG2 was 0.5 nmol/g of protein. Data shown are the mean ± S.D. (n = 3) of three independent experiments. N.D., not determined.

