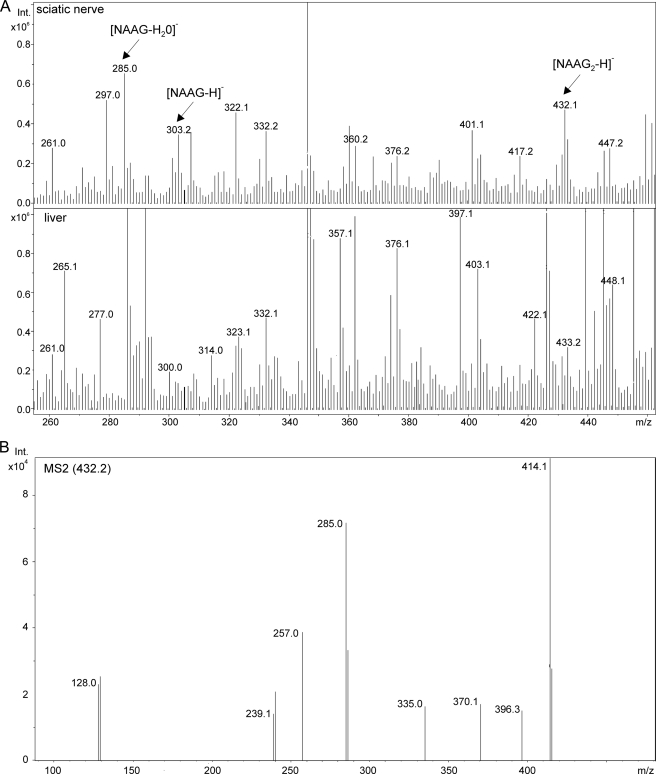
FIGURE 6.
ESI-MS detection of NAAG and NAAG2 in sciatic nerves. A, ESI-MS spectrum of peptide extracts of sciatic nerves and liver from wild-type mice. Mass peaks of m/z = 302.2 and 432.1, corresponding to NAAG and NAAG2, respectively, were detectable in sciatic nerves but not in the liver. B, the fragmentation pattern of the m/z = 432.1 mass peak obtained from sciatic nerve peptide extracts was in line with the NAAG2 structure (see fragmentation scheme in Fig. 4C), and comparable with the fragmentation pattern of synthetic NAAG2 (see supplemental Fig. S2).

