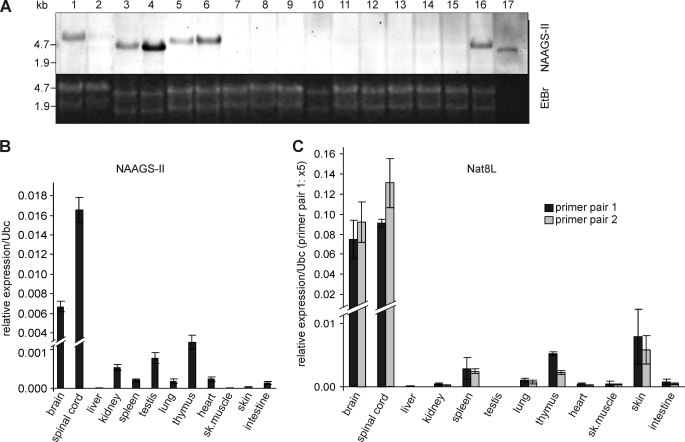
FIGURE 8.
Expression of NAAGS-II in different mouse tissues. A, Northern blot analysis of NAAGS-II in different tissues of 10-week-old C57BL/6 mice using digoxigenin-labeled antisense cRNA probe, followed by chemiluminescence detection. RNA (20 μg/lane, except spinal cord, where only 5 μg was loaded) of the following tissues was analyzed: head of an embryo at E12.5 (1), body of embryo E12.5 without head (2), cerebellum (3), brain stem (4), forebrain (5), total brain (6), liver (7), spleen (8), kidney (9), adrenal gland (10), testis (11), lung (12), thymus (13), heart (14), skeletal muscle (15), eyes (16), and spinal cord (17). B, quantitative RT-PCR of NAAGS-II expression in various tissues of 10-week-old mice. Shown are the relative expressions after normalization to ubiquitin C (Ubc) as housekeeping control. C, quantitative RT-PCR of Nat8l expression in various tissues of 10-week-old mice. Two different primer pairs were used (see “Experimental Procedures”). Real time PCR data shown are the mean ± S.D. (n = 3) of three independent experiments (using RNA preparations from three different mice).

