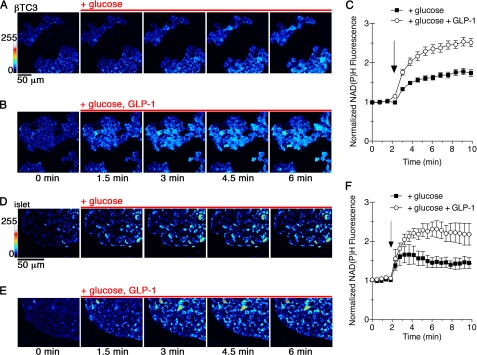
FIGURE 1.
GLP-1 potentiates glucose metabolism in pancreatic β cells. A–C, NAD(P)H autofluorescence from βTC3 cells was captured by two-photon excitation fluorescence microscopy. Glucose-starved cells were stimulated with 5 mm glucose alone (A) or in combination with 30 nm GLP-1 (B). A pseudocolor lookup table was applied to the images to indicate fluorescence intensity. C, time-resolved changes to NAD(P)H were normalized to the mean prestimulated fluorescence for cells treated with glucose (black squares) or glucose and GLP-1 (open circles). Points represent the mean ± S.E. (error bars) for n = 50 cells. The arrow indicates addition of reagents. D–F, two-photon images of an islet cultured in 2 mm glucose prior to addition of 5 mm glucose (D) or glucose and 30 nm GLP-1 are shown. E, changes in NAD(P)H were quantified. The data indicate the average cell responses (±S.E.) from at least 20 cells per islet, n = 3 islets. NAD(P)H intensity was normalized to baseline, prestimulation fluorescence. The arrow indicates addition of stimulatory reagents.

