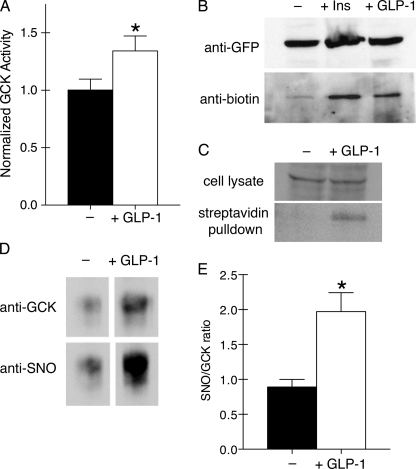
FIGURE 2.
GLP-1 stimulates GCK activation and post-translational S-nitrosylation. A, GCK activity was measured from lysates of βTC3 cells that were glucose- and serum-starved (black) or treated with 30 nm GLP-1 for 5 min (white). Bars indicate mean ± S.E. (error bars) for n = 5 experiments. * indicates significance (p < 0.05) as determined by a two-tailed t test. B, S-nitrosylation of GCK-mVenus was observed in transfected cells left untreated (−) or stimulated with either insulin (100 nm, 5 min) or GLP-1 (30 nm, 5 min). S-Nitrosylated cysteines were modified with biotin in lysed cells using the biotin-switch assay (14, 19) prior to immunoprecipitation with anti-fluorescent protein antibodies. Precipitates were then Western blotted for the fluorescent protein tag (top) or the S-nitrosylation-indicating biotin. C, S-nitrosylation of endogenous GCK was detected by performing the biotin-switch assay on cell lysates from untreated (−) and GLP-1-treated cells (30 nm, 5 min). Biotinylated proteins were isolated using streptavidin-conjugated agarose beads. GCK was detected by Western blotting on cell lysates and streptavidin pulldowns using anti-GCK antibodies. D, islets were treated with 30 nm GLP-1 for 10 min prior to lysis. GCK was immunoprecipitated and assessed for GCK and SNO by Western blotting. E, ratio of SNO to GCK was quantified using ImageJ. Bars indicate mean ± S.E. (error bars) for n = 4 experiments. * indicates significance (p < 0.05) as determined by a two-tailed t test.

