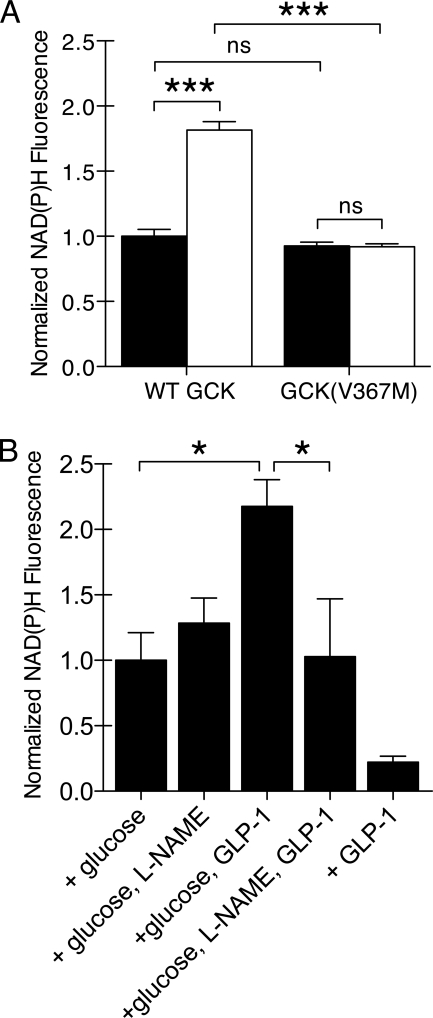
FIGURE 4.
Dependence of GLP-1-potentiated glucose metabolism on GCK S-nitrosylation. A, changes in NAD(P)H fluorescence were observed by two-photon fluorescence microscopy for βTC3 cells expressing GCK-mCherry or GCK(V367M). Cells were stimulated with 5 mm glucose alone (black) or in combination with 30 nm GLP-1 (white). The NAD(P)H fluorescence at 3 min was normalized to basal, prestimulation fluorescence. Bars indicate mean ± S.E. (error bars), and statistical significance (ANOVA, n = 5, Tukey multiple comparison test) is indicated by symbols as follows: ***, p < 0.001; ns, p > 0.05. B, changes in islet NAD(P)H fluorescence were observed by two-photon microscopy. Islets were incubated with 2 mm glucose for 60 min prior to stimulation with 5 mm glucose and/or 30 nm GLP-1 as indicated. Prior to stimulation, some islets were pretreated with 5 mm l-NAME to inhibit NOS activity. Bars indicate mean ± S.E., and statistical significance (ANOVA, n = 5, Tukey multiple comparison test) is indicated by * (p < 0.05).

