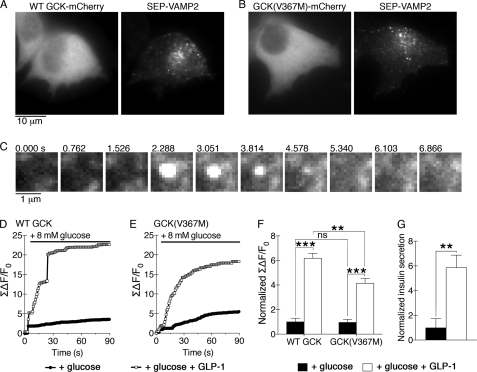
FIGURE 5.
GCK(V367M) expression diminishes GLP-1 potentiation of secretory granule fusion. A and B, TIRFM was used to observe secretory granule fusion in βTC3 cells co-transfected with SEP-VAMP2 and either WT GCK-mCherry (A) or GCK(V367M)-mCherry (B). Red mCherry fluorescence was collected using widefield epifluorescence illumination, and SEP-VAMP2 fluorescence at the cell membrane adjacent to the coverslip was collected using TIRFM. C, membrane fusion of a SEP-VAMP2-labeled secretory granule during a typical exocytotic event is shown. D, sum change in membrane fluorescence over time is shown for SEP-VAMP2 fluorescence in βTC3 cells co-expressing WT-GCK-mCherry captured using TIRFM. Plots show a representative trace of a cell treated with either glucose alone (black circles) or pretreated with GLP-1 (30 nm, 10 min, white squares). E, representative traces as in D from cells co-expressing GCK(V367M)-mCherry are shown. F, sum changes in fluorescence were normalized to glucose-treated groups for 30 frames (22 s) following glucose stimulation for WT and V367M GCK-mCherry-expressing cells. Bars indicate mean ± S.E. (error bars), and statistical significance (ANOVA, n = 5, Tukey multiple comparison test) is indicated by symbols as follows: **, p < 0.01; ***, p < 0.001; ns, p > 0.05. G, insulin secretion from untransfected βTC3 cells was measured by ELISA. Cells were treated with glucose in the presence or absence of GLP-1 and normalized to results from glucose-treated cells. Error bars indicate S.E., and statistical significance was determined by t test (**, p < 0.01, n = 5).

