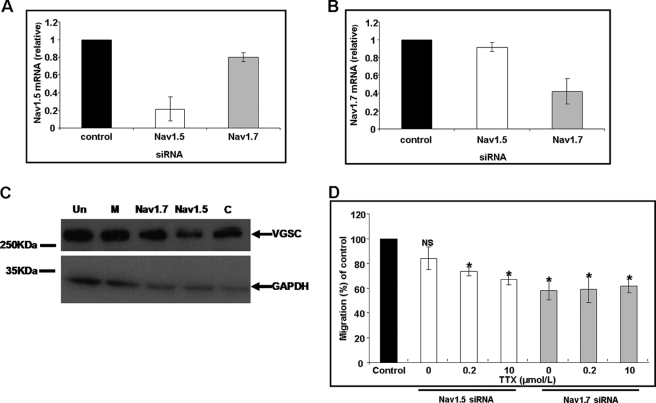
FIGURE 4.
Effect of VGSC (Nav1.5 and Nav1.7) siRNAs on chemotaxis. mRNA measurements following treatments of HUVECs with Nav1.5 (A) and Nav1.7 (B) siRNA. Normalized levels of mRNA at 72 h relative to cells transfected with non-targeting siRNA are shown. White bars, Nav1.5 siRNA-transfected HUVECs. Gray bars, Nav1.7 siRNA-transfected HUVECs. Bars, mean ± S.E. from 2−ΔΔCT analysis (n = 3). C, representative Western blots of proteins from siRNA-treated HUVECs using a pan-VGSC primary antibody and GAPDH. Un, untreated; M, mock-transfected; other lane labels are as in A. D, Transwell chemotaxis of HUVECs treated with Nav1.5 or Nav1.7 siRNA. Data are shown as percentage controls. Samples are as in A but also showing the effect of TTX applied post-transfection. Each bar denotes mean ± S.E. (error bars) (n = 3). *, p < 0.05.

