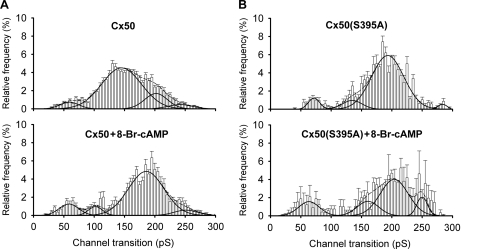
FIGURE 10.
PKA activation affects the behavior of Cx50 (A) and Cx50(S395A) mutant (B) channels. Histograms of events in the absence (top panels) and in the presence of 8-Br-cAMP (bottom panels) revealed for the wild-type protein a large decrease in frequency of transitions between the residual and ∼200 pS open state (∼145 pS transitions) and a corresponding increase in frequency of transitions between the closed and ∼200 pS open state following PKA activation. For the mutant channel, the histogram of untreated channels appears similar to the histogram for treated wild-type channels, with PKA inducing a decrease in frequency of the closed to ∼200 pS open state transitions, with increases in frequency of all other transition types. Interval = 5 pS; black lines indicate the fit for every peak (solid lines) and the sum of all fits (dashed lines). Fit parameters for each plot (conductance and percentage of events for each peak and overall quality of fit) were as follows: Cx50 untreated, 59 ± 3 pS (6%), 145 ± 0 pS (fixed width) (74%), 202 ± 8 pS (16%), and 242 ± 30 pS (5%) (R2 = 0.98; number of experiments, n = 11, number of transitions, n = 2540); Cx50 treated, 58 ± 2 pS (11%), 102 ± 2 pS (6%), 185 ± 2 pS (77%), and 251 ± 9 pS (6%) (R2 = 0.95; n = 6, n = 889); Cx50(S395A) untreated, 72 ± 1 pS (6%), 135 ± 6 pS (8%), 193 ± 2 pS (84%), and 284 ± 1 pS (2%) (R2 = 0.97; n = 5, n = 676); and Cx50(S395A) treated, 62 ± 3 pS (16%), 101 ± 16 pS (17%), 204 ± 8 pS (56%), and 250 ± 5 pS (11%) (R2 = 0.94; n = 3, n = 950).

