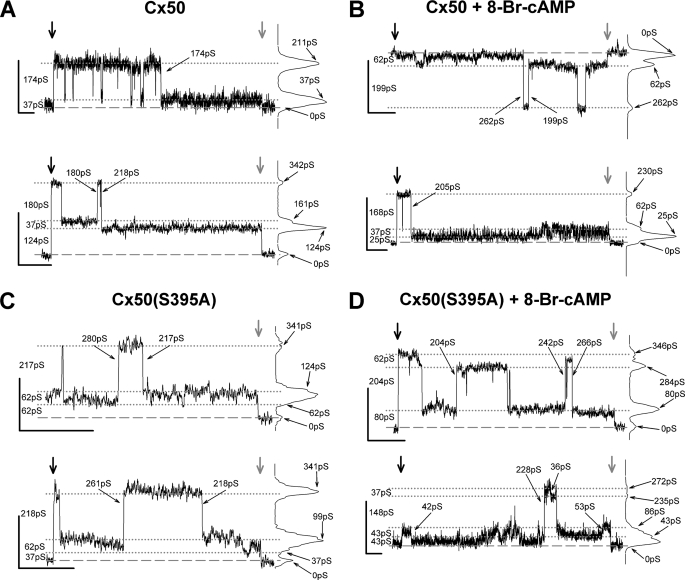
FIGURE 9.
Open state conductances of Cx50 and Cx50(S395A) comprised channels are comparable. Primary records and associated all points histograms from Cx50 (A and B) and Cx50(S395A) mutant (C and D) gap junctions illustrate channel activity and event amplitudes in the absence (A and C) and in the presence (B and D) of 8-Br-cAMP. Recordings were screened for sections with only one large amplitude channel event evident, and amplitudes of all current levels were measured. Traces (two examples for each group) show some of the amplitudes encountered and the variability of channel behavior. All points histograms are displayed to the right of each trace. Broad vertical arrows mark the start (black) and end (gray) of the transjunctional voltage pulse, except for upper trace in C, where the start of a longer pulse is not shown. Black lines mark the base line (dashed) and several (dotted) current levels; conductance values on the left of each trace indicate the conductance differences between these successive levels. The small arrows and values on the histograms indicate the cumulative conductance values from base line; small arrows and values on the traces show the conductances of indicated transitions. Calibration for all traces: y = 10 pA; x = 2 s. The conductance steps were calculated as γj = Ij/Vj, where Vj = ±40 mV.

