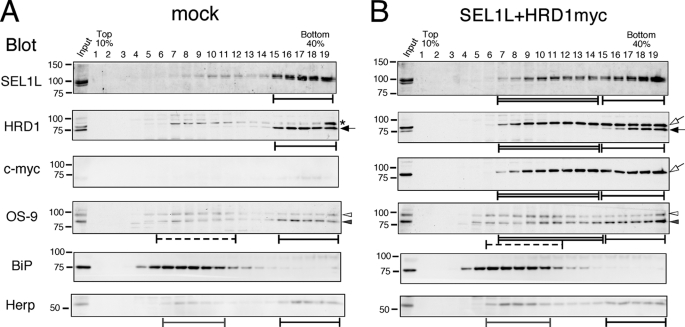
FIGURE 4.
Transient expression of SEL1L and HRD1 forms a smaller complex in addition to the large endogenous complex. Cell extracts transfected with mock (A) or SEL1L and HRD1 (B) were fractionated with a 10–40% sucrose density gradient generated using Gradient MasterTM without the 60% sucrose cushion. Black bars indicate the fractions where the large ERAD complex containing HRD1-SEL1L, OS-9, Herp, and Derlins was sedimented (Complex I). Double-lined bars show the smaller fractions detected by the transient expression of HRD1-SEL1L (Complex II). Dotted bars indicate the fractions containing OS-9 of a lower sedimentation rate. Fractions containing the second peak of Herp are indicated by the gray bars. The asterisk denotes the nonspecific signal observed by the anti-HRD1/synoviolin antibody. Arrows and arrowheads are as in Fig. 3.

