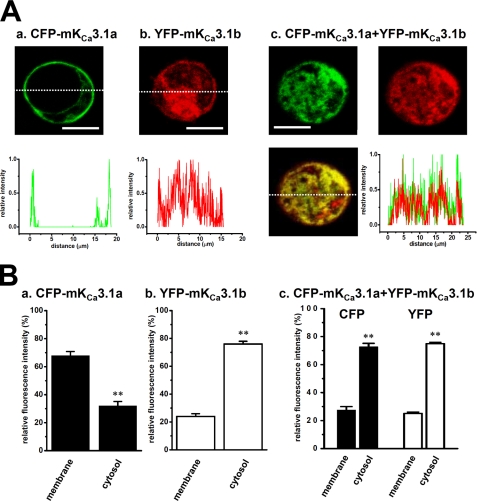
FIGURE 5.
Cellular distribution of murine KCa3.1 in HEK293 cells. A, CFP-tagged mKCa3.1a-transfected HEK293 cells, CFP image (upper panel) and the profile on the dotted line (lower panel) are shown in green (panel a). In YFP-tagged mKCa3.1b-transfected HEK293 cells, YFP image (upper panel) and the profile on the dotted line (lower panel) are shown in red (panel b). In CFP-tagged mKCa3.1a and YFP-tagged mKCa3.1b-co-transfected HEK293 cells, CFP (upper, left) and YFP (upper, right) images are shown in green and red, respectively, and the merged image (lower, left) and the profiles on the dotted line (lower, right) of CFP and YFP in yellow (panel c). Bar, 20 μm. B, summarized data from A, panels a–c. Data are expressed as the means ± S.E. **, p < 0.01 versus plasma membrane fractions.

