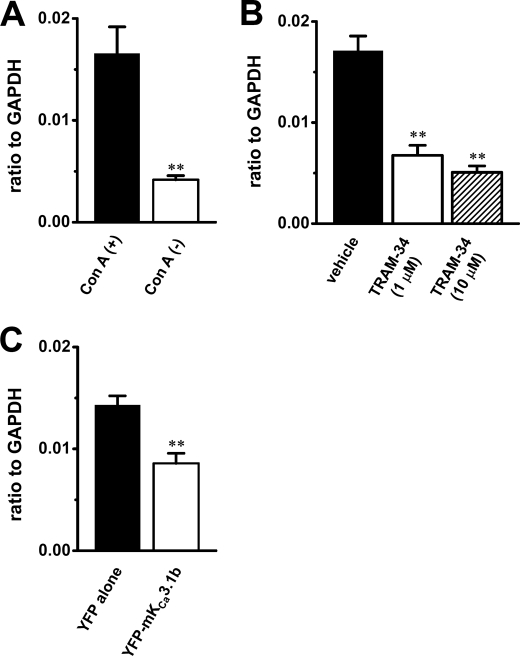
FIGURE 9.
Quantitative real time PCR for interleukin-2 expression in mouse thymocytes. A, closed and open columns show interleukin-2 expression in Con-A(+) and Con-A(−) thymocytes, respectively. Values are shown for steady state transcripts relative to GAPDH in the same preparation (n = 4 for each, p < 0.01). B, closed, open, and hatched columns show interleukin-2 expression in Con-A(+) thymocytes treated with vehicle (0.1% DMSO), 1 μm TRAM-34, and 10 μm TRAM-34, respectively (n = 4 for each, p < 0.01 versus vehicle). C, closed and open columns show interleukin-2 expression in Con-A(+) thymocytes transfected with pEYFP-C (YFP alone) and pEYFP-mKCa3.1b (YFP-mKCa3.1b), respectively (n = 4 for each, p < 0.01).

