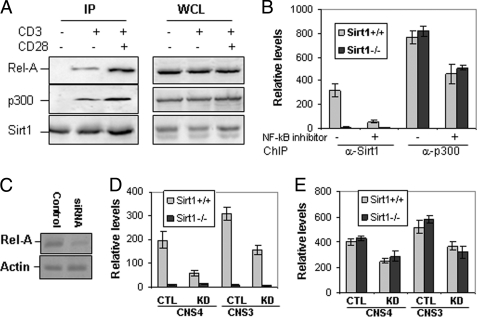
FIGURE 5.
Rel-A, Sirt1, and p300 form a complex in T cells. A, primary T cells from wild-type mice were stimulated with anti-CD3 or anti-CD3 plus anti-CD28 for 2 h and lysed. The cell lysate was immunoprecipitated (IP) with anti-Sirt1 antibody. Sirt1-bound Rel-A (left top panel) and p300 (left middle panel) were detected with anti-Rel-A and anti-p300 antibodies, respectively. The same membrane was reprobed with anti-Sirt1 as a control (left bottom panel). The expression levels of Rel-A, Sirt1, and p300 in the whole cell lysates (WCL) were determined by Western blotting as controls (right three panels). B, mouse CD4 T cells were stimulated with anti-CD3 or anti-CD3 plus anti-CD28 for 16 h in the presence or absence of 10 μm NF-κB inhibitor. The binding of Sirt1 and p300 to bclaf1 promoter CNS4 was analyzed by ChIP assay followed by real-time PCR. C–E, MEF cells were transfected with control (lane 1) or Rel-A-specific siRNA (lane 2). The efficiency of siRNA-mediated knockdown was determined by Western blotting (C). The effects of Rel-A knockdown (KD) on binding of Sirt1 (D) or p300 (E) to bclaf1 promoter CNS4 and CNS3 regions in Sirt1+/+ and Sirt1−/− MEF cells were determined by ChIP assay followed by real-time PCR. CTL, control. Error bars represent data of triplicate wells (mean ± S.D.), and representative data from three independent experiments are shown.

