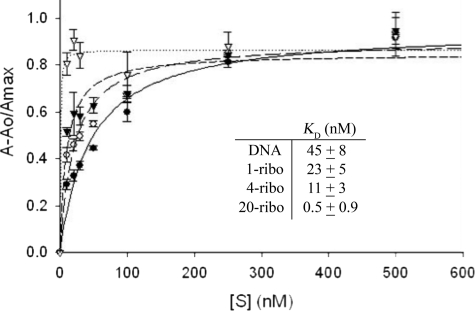
FIGURE 3.
Equilibrium substrate binding by RNase H2 WT. The FAM-labeled duplexes (1 nm) were incubated with increased concentrations of RNase H2 WT and the observed relative fluorescence anisotropy Aobs = A − Ao/Amax was determined as described under “Experimental Procedures” for the 1-ribo (○, long dashes), 4-ribo (▴, short dashes), 20-ribo (△, dots), and DNA (●, solid line). The fluorescence anisotropy data were fit to a single hyperbola to derive KD values (inset).

