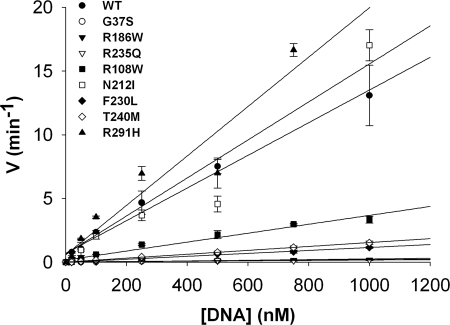
FIGURE 5.
Catalytic efficiencies of the RNase H2A mutants. Reactions containing RNase H2A WT (▴), G37S (●), R186W (▾), R235Q (▿), R108W (■), N212I (□), F230L (⧫), T240M (◊), and R291H (▴) were incubated with increased concentrations of the 1-ribo RNA-DNA substrate. Reaction products were subjected to electrophoresis on 23% polyacrylamide gels, and the products were quantified as described under “Experimental Procedures.” Reaction rates (min−1) were plotted against 1-ribo substrate concentrations. The second-order rate constant (kcat/Km) was estimated from the slope of the linear portion of the steady-state reaction that could be clearly defined for all RNase H2A mutants (Table 3).

