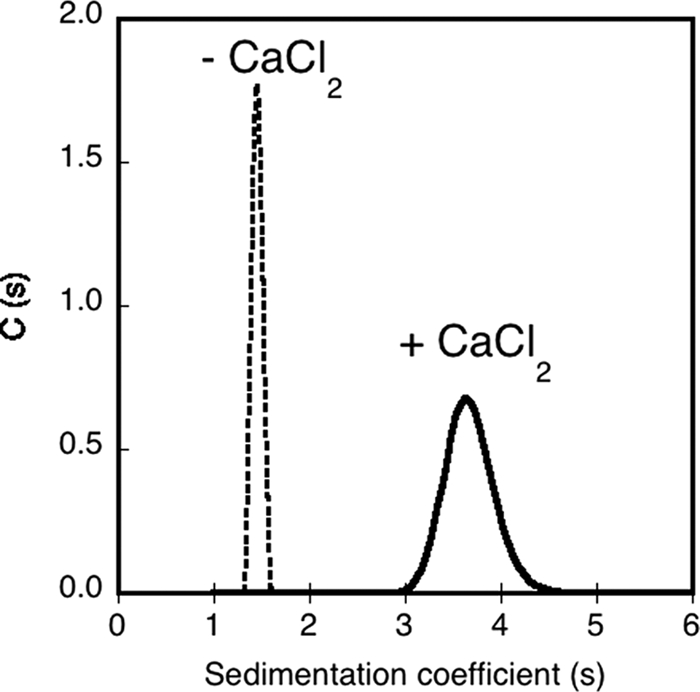
FIGURE 3.

Analytical ultracentrifugation analysis of RCS. Sedimentation coefficient distribution, deduced from the fitted curves, of RCS in the absence (dashed line) or in the presence of 5 mm CaCl2 (solid line). The experimental conditions were: 20 μm RCS and buffer A at 25 °C.
