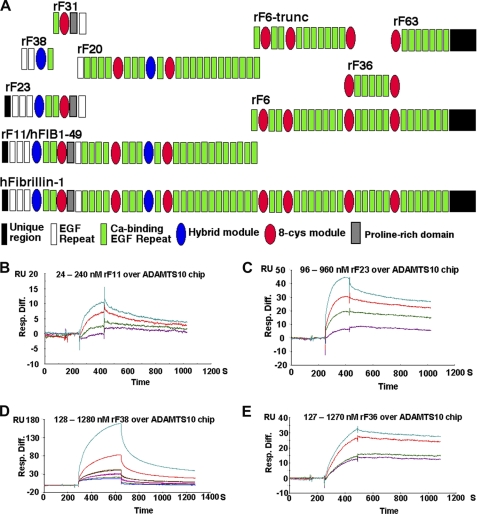
FIGURE 2.
SPR analysis of interactions of full-length ADAMTS10 with fibrillin-1. A, depiction of the domain structure of fibrillin-1 and the peptides used in SPR analysis. B–E, the indicated fibrillin-1 peptides were used as the analyte and flowed over a chip coupled with ADAMTS10 as the ligand. The observed SPR change is indicated in resonance units (RU). Injections utilized a series of molar concentrations for each analyte (the concentration range used is indicated above each set of sensorgrams). Table 1 lists the specific numerical values for binding obtained from these and additional experiments of which the illustrated data are representative. Resp. Diff., response difference.

