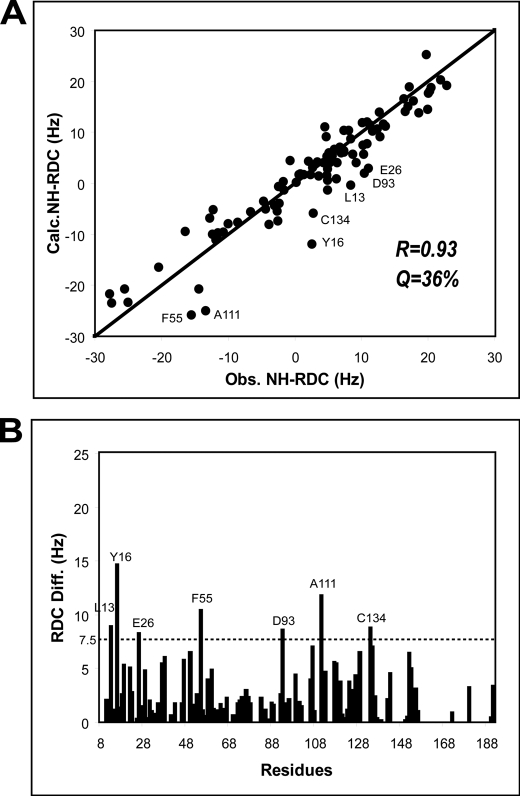
FIGURE 2.
Correlation between the Ca2+-CIB1 and Mg2+-CIB1 solution structures revealed by RDC analysis. The backbone NH-RDC of Mg2+-CIB1 shows a good correlation with the solution structure of Ca2+-CIB1 (A), in which the outliers are labeled. The absolute values of the difference between the observed RDC and calculated RDC are plotted as a function of the primary sequence (B), and a horizontal line highlights the outliers.

