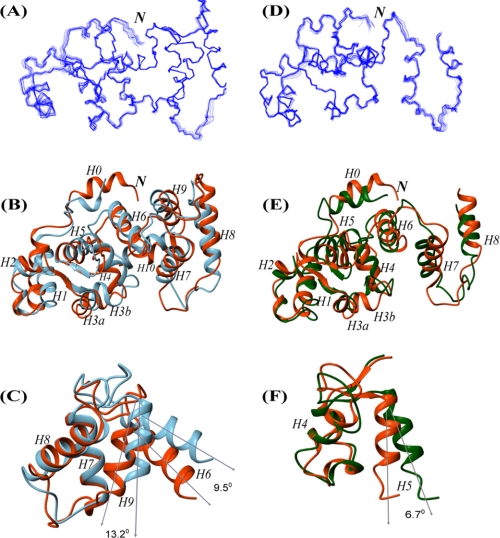
FIGURE 3.
Solution structures of Ca2+-CIB1 and Mg2+-CIB1. A, ensemble of the 20 best solution structures of Ca2+-CIB1. B, superimposed solution structure (red) and crystal structure (1XO5, blue) of Ca2+-CIB1 with an r.m.s.d. of 2.71 Å for the well defined areas (residues 24–136 and 146–191). C, superimposed EF-III (H6 and H7) and EF-IV (H8 and H9) region (residues 102–180) of the Ca2+-CIB1 crystal (1XO5, blue) and solution structures (red) demonstrate that the solution structure has a more closed conformation than the crystal structure. The two structures were superimposed based on H7 and H8; thus, the opening was highlighted by the orientations of H6 and H9, respectively. D, ensemble of the calculated 20 best structures of Mg2+-CIB1. E, superimposed solution structure of Ca2+-CIB1 (red) and Mg2+-CIB1 (green) with an r.m.s.d. of 3.27 Å for the well defined areas (residues 24–136 and 146–157). F, superimposed EF-II (H4 and H5) of the solution structures of Ca2+-CIB1 (red) and Mg2+-CIB1 (green) demonstrate that Mg2+-CIB1 has a more opened conformation than Ca2+-CIB1. The two structures were superimposed based on H4; thus, the opening was highlighted by the orientations of H5. The letter N in italics indicates the N terminus of the protein.

