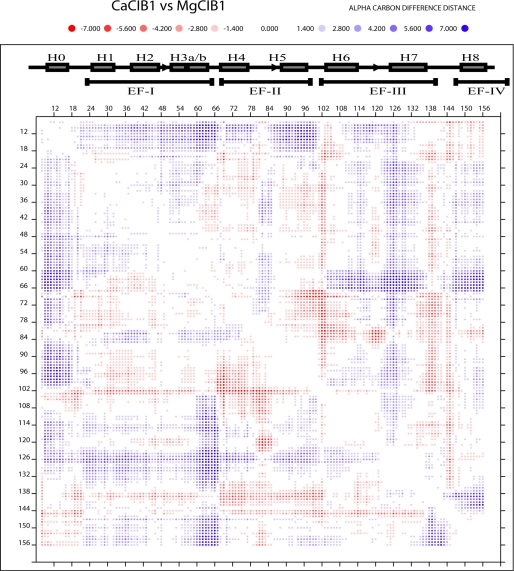
FIGURE 4.
Difference distance matrix plot to compare the structural differences between Ca2+-CIB1 and Mg2+-CIB1 (residues 8–157). The secondary structure was labeled with filled boxes indicating helices and arrows indicating β-strands. The program DDMP gives real values of differences concerning Cα atoms in two structures. For example, the distance between the Cα atoms of i and j residues in the Ca2+-CIB1 structure is 10 Å, and the corresponding distance in structure Mg2+-CIB1 is 15 Å, and hence [(Ca2+-CIB1)-(Mg2+-CIB1)]ij = 10–15 = −5 Å. The red and blue color shading is indicated above the figure.

