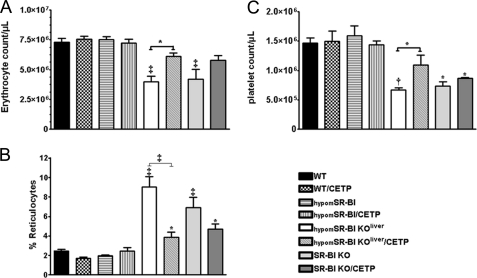
FIGURE 2.
Erythrocyte, reticulocyte, and platelet counts. Blood isolated from male mice was analyzed by flow cytometry to determine the absolute counts of erythrocytes (A), reticulocytes (expressed as a percentage of total erythrocytes) (B), and platelets (C) (n = 4–9; data represent mean ± S.E.). *, †, and ‡ denote a statistical difference versus WT mice or between indicated groups, *, p < 0.05; †, p < 0.01; and ‡, p < 0.001.

