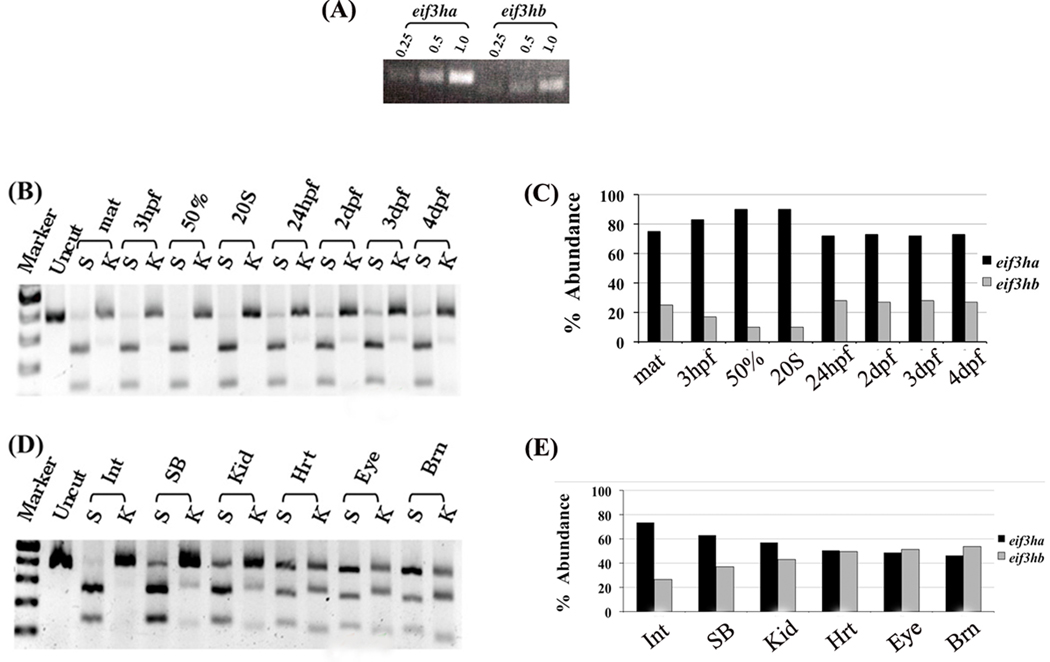
FIG. 2. Both zebrafish genes are expressed, with eif3ha transcript levels being predominant during early embryogenesis.
(A) Semi-quantitative RT-PCR analysis of total RNA isolated from 24 hpf embryos using two different pairs of primers that are specific for each ortholog. RT-PCR was performed using 0.25, 0.5 or 1.0 µg of total RNA as substrate. (B–E) Semi-quantitative RT-PCR using a single set of forward and reverse primers that amplify both eif3ha and eif3hb mRNAs followed by diagnostic digestion with either StuI (S) cleaving eif3ha cDNA or KpnI (K) cleaving eif3hb cDNA. (B) Samples were derived from embryos at different developmental stages as indicated; zygote (maternal, mat), 3 hpf, 50% epiboly (50%), 20 somite (20S), 24 hpf, 2, 3 or 4 days post fertilization (dpf). (D) Samples from different adult organs: intestine (Int), Swim-bladder (SB), kidney (Kid), heart (Hrt), eye or brain (Brn). (C) and (E) show the graphical quantification of the gel electrophoresis results shown in (B) and (D), respectively. It should be noted that experiments in panels B and D and the corresponding quantification in panels C and E are representative of several independent experiments.

