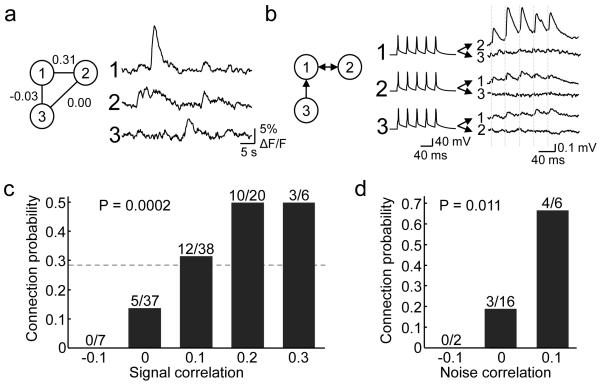
Figure 3. Relationship between response correlation to natural movies and connection probability.
a, An example of a triplet of neurons targeted for whole cell recording in vitro, with associated in vivo calcium responses to the natural movie (average of 6 repetitions) and spike rate correlation values. Neuron 1 and 2 showed correlated firing (signal correlation = 0.31), whereas other pairs did not. b, Triple recordings from the same neurons reveals the pattern of connections: neurons 1 and 2 were bidirectionally connected, while neuron 3 provided input to neuron 1. Dashed lines indicate timing of presynaptic spikes. c, There was a significant increase in connection probability with increasing signal correlation to natural movies (P = 0.0002, Cochran-Armitage test). Dotted line indicates connection probability for all pairs included in this analysis (30/108, 0.28). d, Connection probability increased significantly with increase in noise correlation (P = 0.011, Cochran-Armitage test). Correlation values were binned, with ranges from −0.15 to −0.05, from −0.05 to 0.05, and so on.

