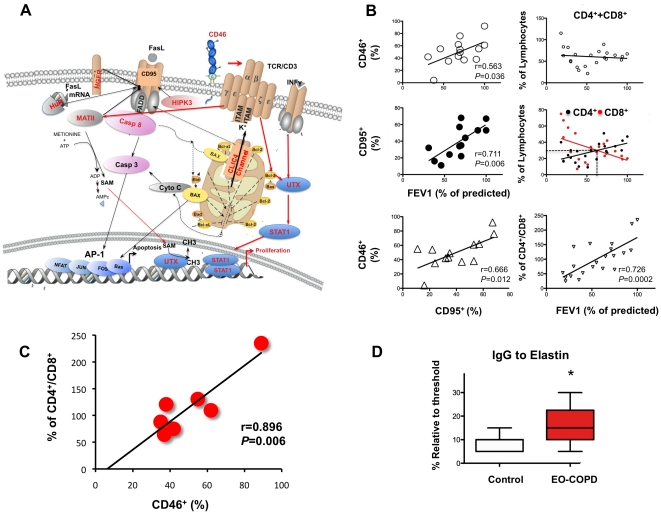
Figure 4. Molecular cross-talk of the protective genes.
(A) CD46 coupling with CD3 activates the transcription factor ubiquitously transcribed tetratricopeptide (UTX), which interacts with signal transducer and activator of transcription 1 (STAT1) both translocate to the nucleus to activate proliferation of CD4+T cells. T cell receptor activates Bcl-2 that inhibits cytochrome C (Cyto C) released by chloride intracellular channel 4 (CLIC4), which positively regulates Fas Ligand receptor (CD95) mediated activation of Caspase 8 (Casp 8) and apoptosis. Homeodomain interacting protein kinase 3 (HIPK3) phophorilates CD95, and HuR stabilizes CD95 mRNA also positively regulates it. While 2 negative regulators of CD95 are methionine adenosyl transferase II, alpha (MATII) and hepatocyte growth factor receptor (HFGR). Red font signifies protective gene, black arrow apoptosis activation, black bold arrow apoptosis inhibition. Red arrow, proliferation pathway. Red proteins are kinases; blue, transcription factors; light brown, cell surface receptors. (B) Total CD46 expression on the surface of lung cells of patients (n = 14) significantly correlates with their FEV1% in a linear regression using minimum square approximation, with a coefficient r = 0.563 and a goodness of fit p = 0.036. The FasL receptor, CD95, protein expression on the same patients, also, positively correlates with FEV1% with an r = 0.711 and a goodness of fit p = 0.006. There is a significative linear association between cells surface proteins expression, CD46+ and CD95+ (r = 0.666, p = 0.012). Right top plot, total lung lymphocytes CD4+ plus CD8+ has a constant number in the lung parenchyma despite their lung FEV1% change with disease progression (r = 0.107, p = 0.6332, n = 22) although there is a significant change in the number of CD4+ and CD8+ T cells. Right middle plot, in the same patients group, CD4+T cells (black circles) correlates directly with the FEV1% (r = 0.549, slope = 0.24, p = 0.008, n = 22), conversely CD8+ T cells (red circles) inversely correlates with FEV1% increasing its number with disease progression (r = 0.480, slope = −0.329, p = 0.024). Bottom right plot shows a direct correlation between FEV1% and depletion of CD4+ with increment of CD8+ T cells (slope = 8.4, r = 0.726, p = 0.0002). (C) There is a remarkable association among CD46+ decrement and CD4+/CD8+ ratio of T cells, r = 0.896 p = 0.006, n = 7. (D) Increased IgG to elastin in early-onset COPD (EO-COPD) patients, relative to normal controls, tested in n = 21 and n = 28, respectively, plot represents the patients that give signal above the threshold n = 9 for both EO-COPD and control with a significant increased in the diseased group p = 0.038, determined by Mann-Whitney test, values represent median ± SD.

