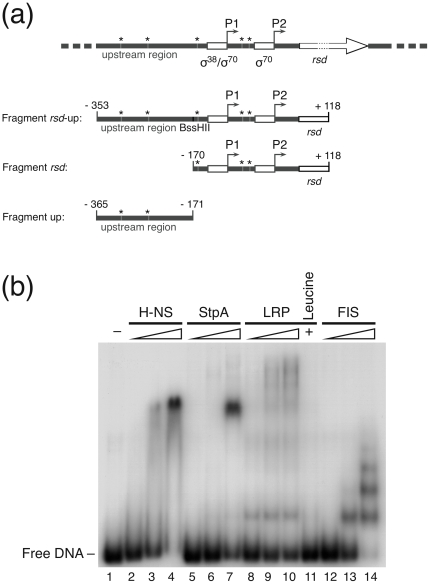
Figure 5. Binding of transcription factors to the rsd-promoter region.
(a) The first line depicts a schematic representation of the rsd gene (open arrow) arrangement with the two promoters P1 and P2 (open boxes) with their upstream regulatory region. The figure is not drawn to scale. Arrows indicate transcription start points and the direction of transcription. The sigma factor specificities for the respective promoters are marked by σ70 or σ38, respectively. Asterisks indicate the positions of GATC dam methylation sequences. The lines below indicate different fragments (rsd-up, rsd and the up fragment) isolated for binding and footprintig studies. The sequence positions of the fragment ends relative to the transcription start site of the rsd P2 promoter are indicated. (b) Autoradiogram of a retardation analysis with the rsd fragment. Increasing concentrations of the NAP transcription factors were employed for binding: lane 1: no protein; lanes 2 to 4: H-NS (2 µM, 4 µM and 6 µM, respectively); lanes 5 to 7: StpA (0.5 µM, 2 µM and 6 µM, respectively); lanes 8 to 10: LRP (0.25 µM, 1 µM and 2 µM, respectively); lane 11: LRP (2 µM together with 30 mM leucine); lanes 12 to 14: FIS (0.1 µM, 0.5 µM and 2 µM, respectively).

