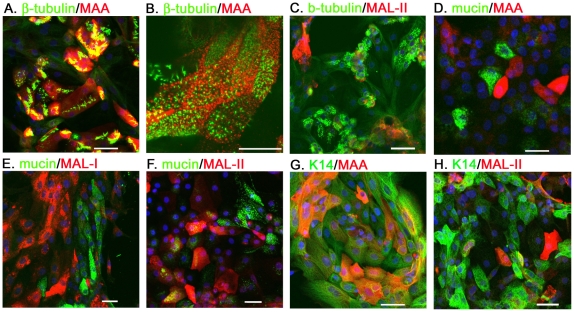
Figure 1. The SAα2–3Gal expression of primary CTE cells.
The ciliated cells, goblet cells and basal cells were revealed by their specific markers: the β-tubulin (A–C), mucin (D–F) and K14 (G, H), respectively. The cellular distribution of SAα2–3Gal was characterized by the double-staining of biotin-labeled MAA (EY Laboratories, 1∶500) (A, B, D, G), MAL-1 (E) or MAL-II (both from Vector laboratories, 1∶500) (C, F, H). Scale bar, 50 µm.

